The Intelligence Engine to Scale Your Business
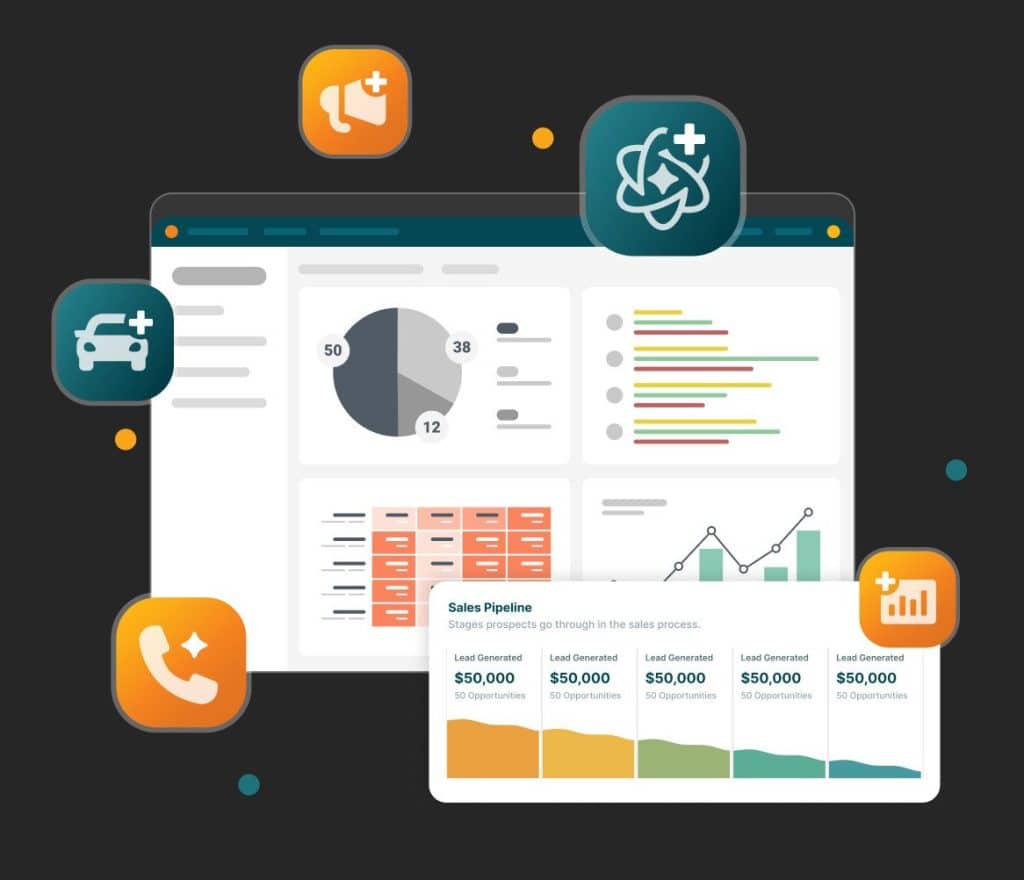
Go beyond standard reports with Analytics+. Build unlimited dashboards, utilise our advanced BI widget library, and create advanced tabular reports.

Turn Your Data into Your Greatest Asset
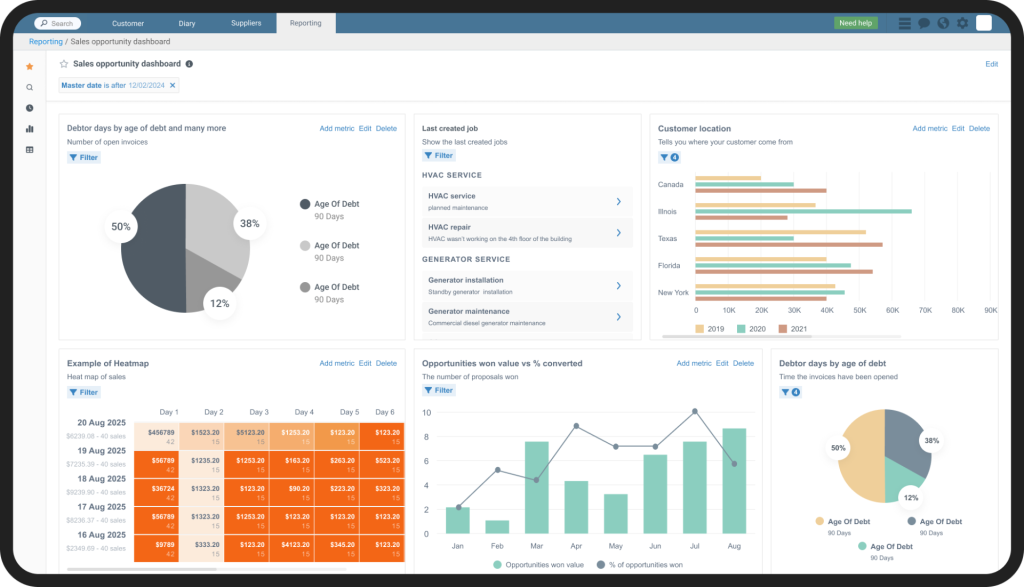
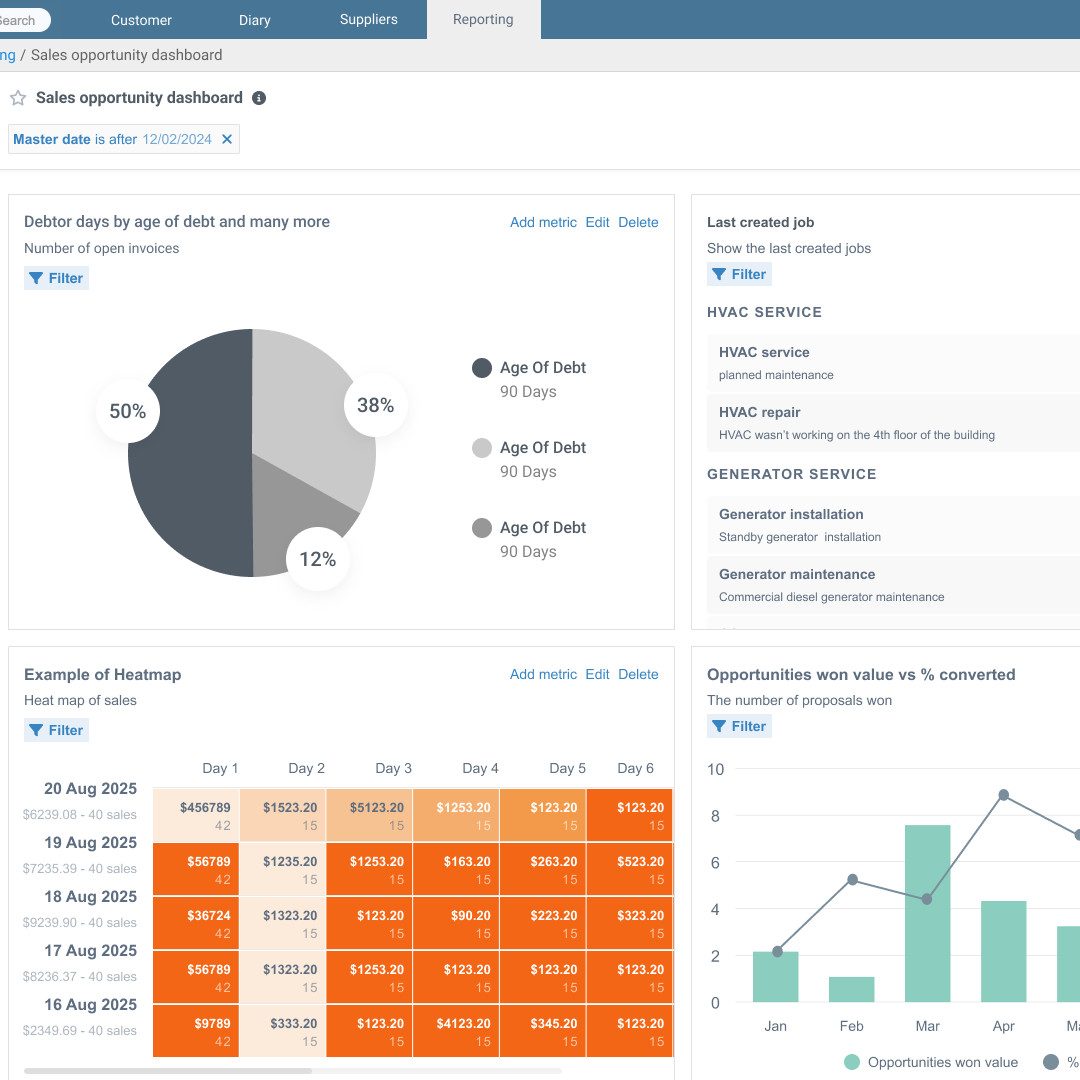
Build the Perfect Dashboard for You
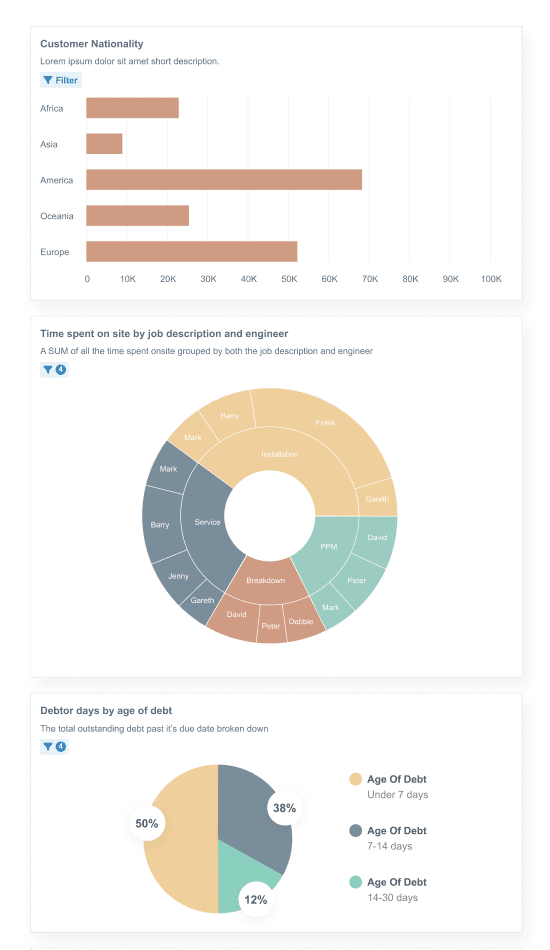
Create a command center for every role in your business. Design the perfect view for owners, service managers, and sales teams. Use our extensive library of advanced BI widget options to visualise the KPIs that matter most to each part of your operation.
Share Insights Across Your Team
Keep your entire team aligned and focused on the same goals. Every dashboard can be made shareable, allowing you to provide key stakeholders with the insights they need. For team-wide visibility, use the TV view to display real-time metrics in your office, motivating your team and celebrating wins.
Automate Your Reporting
Save time and ensure consistency by putting your reporting on autopilot. The schedule and send reports feature on Analytics + lets you have critical reports automatically generated and emailed to key stakeholders on a daily, weekly, or monthly basis. Everyone gets the information they need, right in their inbox, without any manual effort.
Build the Perfect Dashboard for You
Create a command center for every role in your business. Design the perfect view for owners, service managers, and sales teams. Use our extensive library of advanced BI widget options to visualise the KPIs that matter most to each part of your operation.
Share Insights Across Your Team
Keep your entire team aligned and focused on the same goals. Every dashboard can be made shareable, allowing you to provide key stakeholders with the insights they need. For team-wide visibility, use the TV view to display real-time metrics in your office, motivating your team and celebrating wins.
Automate Your Reporting
Save time and ensure consistency by putting your reporting on autopilot. The schedule and send reports feature on Analytics + lets you have critical reports automatically generated and emailed to key stakeholders on a daily, weekly, or monthly basis. Everyone gets the information they need, right in their inbox, without any manual effort.
Create a command center for every role in your business. Design the perfect view for owners, service managers, and sales teams. Use our extensive library of advanced BI widget options to visualise the KPIs that matter most to each part of your operation.
Keep your entire team aligned and focused on the same goals. Every dashboard can be made shareable, allowing you to provide key stakeholders with the insights they need. For team-wide visibility, use the TV view to display real-time metrics in your office, motivating your team and celebrating wins.
Save time and ensure consistency by putting your reporting on autopilot. The schedule and send reports feature on Analytics + lets you have critical reports automatically generated and emailed to key stakeholders on a daily, weekly, or monthly basis. Everyone gets the information they need, right in their inbox, without any manual effort.
Deep Dive into Your Data with Advanced Reporting
Go beyond high-level dashboards for granular analysis. Analytics+ introduces advanced tabular reports & permissions, allowing you to build complex, spreadsheet-style reports to investigate every aspect of your business. Granular permissions ensure that team members only see data relevant to their role, maintaining data security and confidentiality.

As a general contractor handling both project work and service calls for commercial and multi-family clients, finding the right CRM has been challenging—until we found Commusoft.
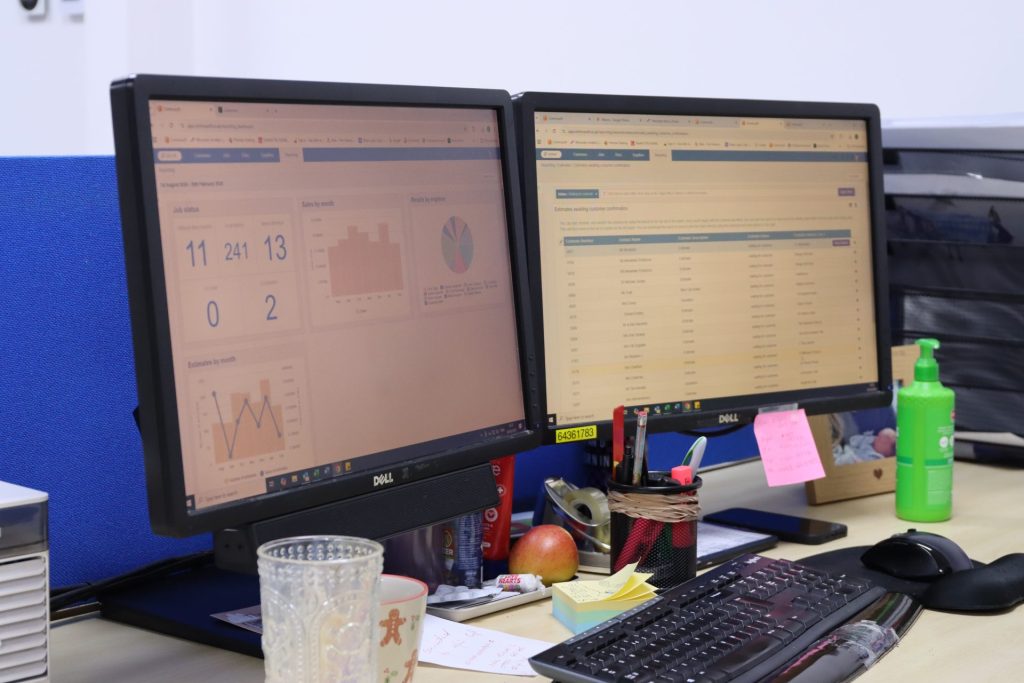
From the Office TV to Your Inbox
Access your business intelligence in the format that works best for you. Use the TV view to create a dynamic, highly visible data wall that keeps your team engaged with live performance metrics. For individual accountability and on-the-go updates, the schedule and send reports feature delivers detailed reports directly to your email, ensuring you’re always connected to the health of your business.
A True Business Intelligence (BI) Suite


Frequently Asked Questions
How is Analytics+ different from the enhanced reporting feature in Commusoft?
While our standard reports are excellent for day-to-day operational tracking, Analytics+ is a full business intelligence (BI) suite available as an add-on. It offers far greater flexibility with an unlimited dashboard allowance, a much wider range of advanced BI widget types, and the ability to create and share highly customised views for every part of your business.
Can I display our key metrics on a TV in our office?
Yes. The TV view feature is designed specifically for this. You can create a dashboard with your most important live KPIs and display it on a large screen to keep your entire team aligned, motivated, and aware of real-time performance.
Can I schedule reports to be sent to me automatically?
Absolutely. The schedule and send reports feature is a core part of Analytics+. You can choose any report, select the recipients, and set a schedule (daily, weekly, monthly), and the system will automatically email it out, ensuring consistent reporting without any manual work.
What essential reporting functionalities are included in the enhanced reporting feature?
The standard reporting suite helps you stay in control and manage daily operations by tracking core business health. It includes a personal, customisable dashboard with standard widgets (plus the ability to create custom widgets in specific plans). You also get access to over 100 pre-built tabular reports that you can filter and export (CSV/PDF). All tabular reports are automatically shared with your team. Crucially, these foundational reports operate only on active, non-deleted fields and records, focusing purely on real-time operational data.
Simplify your workflow. Start your free trial today.
Commusoft is a versatile field service software that helps businesses streamline job conversions, optimise scheduling, and enhance customer service.
Commusoft needs the information you provide to contact you about our services. You may unsubscribe from communications at any time. For details, please see our Privacy Policy.